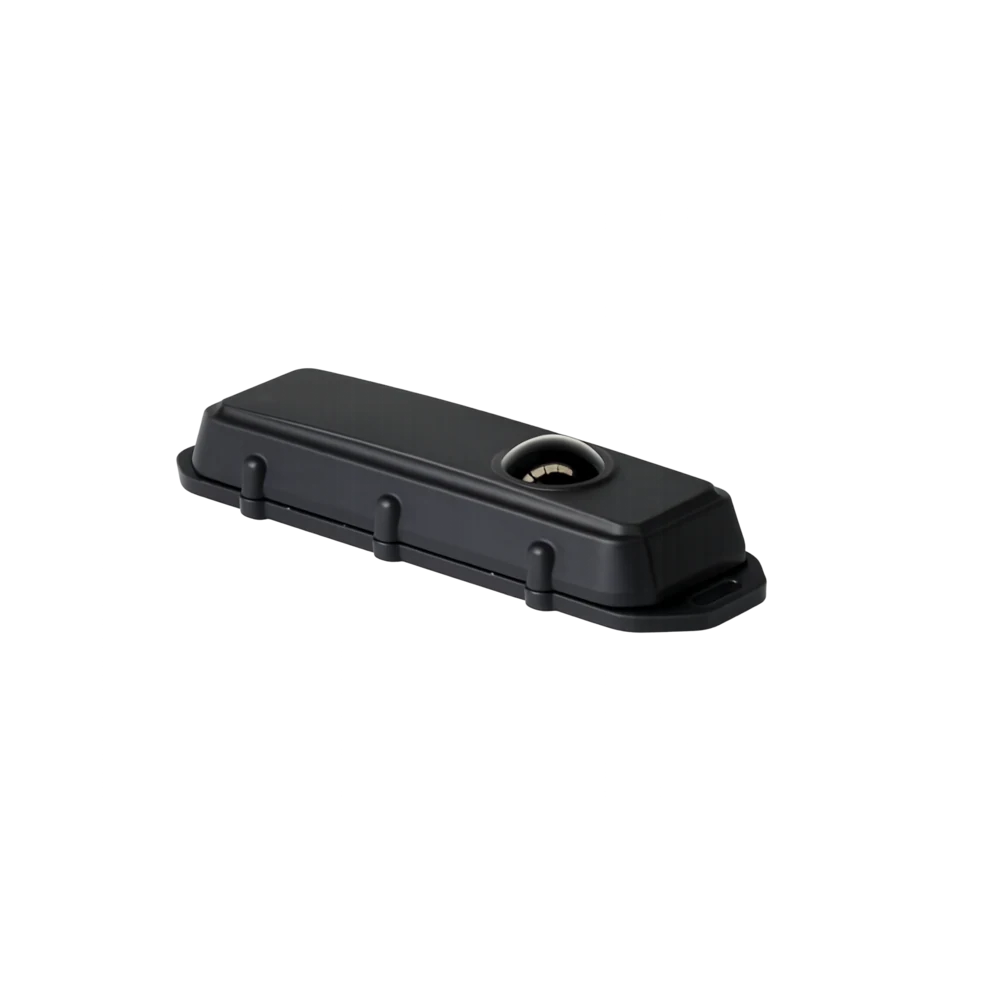
BARRA-RADAR-BLE · Wireless trackers
Barra Radar BLE
Object and Level Detection via Radar Bluetooth device in Barra form-factor (batteries not included)
IN STOCK · ZAR
HomeSolutionsOperations, Workflow & ProductivityFleet and Asset Utilisation Tracking
Operating layer · Solution
Idle vs active time, utilisation by depot, asset-health overlay and right-sized fleet decisions for South African operators. One platform, one view.

Asset productivity on one operational view, paired with the health signals that decide whether each asset can keep earning its day. Vehicles, trailers, machinery and rental equipment each carry a utilisation profile against the operating shift pattern, joined to runtime, fuel-burn and component-wear trends. The Sunday-evening review becomes three concrete decisions ready for the Monday plan: where to redeploy, where to right-size the fleet shape, and where to bring forward a service before the next shift.
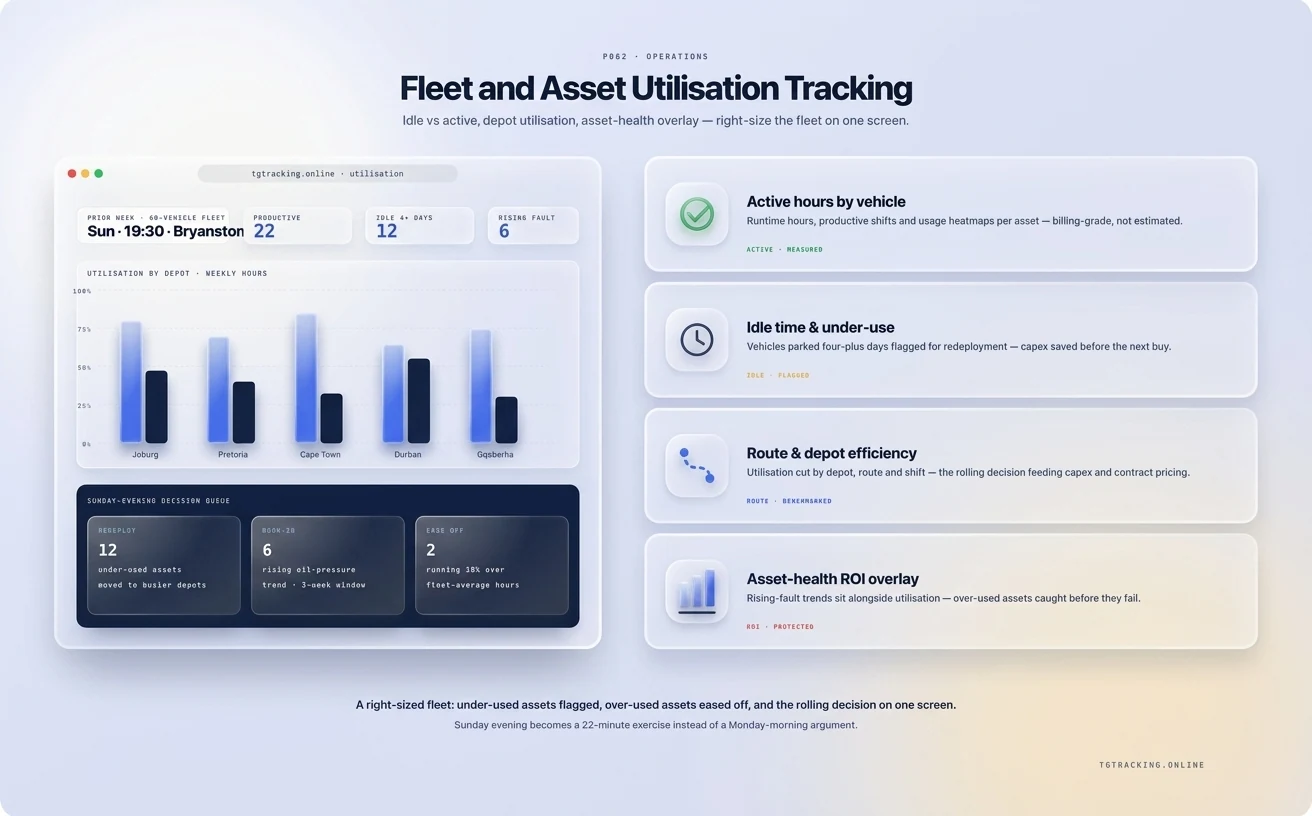
Fleet and Asset Utilisation Tracking from TG Tracking joins per-vehicle and per-asset utilisation with asset-health signals into one operational view. Idle versus active time, utilisation by depot, runtime hours, usage heatmaps and rising-fault trends sit alongside Driving Performance Monitoring, Maintenance Scheduling and Equipment Monitoring Sensors. The output is a right-sized fleet, with under-used assets flagged for redeployment, over-used assets flagged before they fail, and the rolling decision feeding capex and contract pricing. Cluster overview at Operations and Workflow.
A number that says "the fleet is 78% utilised" is not a useful number. The platform breaks utilisation into measurable cuts.
Vehicles (cars, bakkies, trucks). Distance driven, hours driven, idle time, trip frequency, route efficiency. Productive versus unproductive hours per vehicle.
Trailers, containers and towable assets. Time stationary versus moving, cross-site usage, job count per trailer. Pairs with Trailer Management and Wireless Fleet Trailer Tracking.
Machinery and yellow metal. Engine-hour runtime, usage intensity, daily and weekly utilisation, job allocation efficiency. Pairs with Equipment Monitoring Sensors for non-vehicle plant.
Rental and hire equipment. Utilisation rate per asset, idle stock at depot, rental return cycle. The platform feeds the pricing decision so an over-rented unit gets a higher day-rate and an under-rented unit gets the marketing push.
Utilisation alone tells you what an asset is doing. Asset health tells you whether it can keep doing it. The platform layers both into one operational view because the answer to the over-utilised vehicle is a maintenance schedule, not a higher target.
The asset-health layer carries six signals.
A vehicle running 18% over fleet-average hours with a rising oil temperature trend and a worsening fuel-burn pattern surfaces as a single exception, not three separate alerts.
Utilisation data only earns its keep when it informs a decision. The platform turns the dashboard into three operational decisions a fleet manager makes every quarter.
Redeploy. Twelve units sat idle for four-plus days. Two depots have demand and two have surplus. Move four units from depot A to depot B before quarter-end.
Right-size. Six units have run below 30% utilisation for two consecutive months. Three are due for renewal of finance term in the next 90 days. The fleet shape is bigger than demand and the renewal should be smaller.
Reschedule. Two units running 18% over fleet-average hours need an early service. Maintenance Scheduling pulls the service forward by two weeks, the workshop is booked, the operations team plans the swap.
For decisions that need an exec view, the data feeds Business Intelligence Dashboards so the finance director sees the cost-per-kilometre by depot and the capex implication of the right-sizing call.
The Sunday-evening view is the rolling 7-day utilisation board with asset-health overlay. The Monday-morning view is the day's top three exceptions. The Friday-afternoon view is the week ahead's redeployment list. Next Sunday reads against the same baseline so the decision's impact is visible.
Multi-depot fleets see the same metrics by depot, region and sub-fleet. The API and webhooks push utilisation and asset-health data into your BI, ERP or capex planning tool.
A utilisation tool built for stable European demand is not built for local seasonal swings, load-shedding demand effects, mining-contractor cycles, agricultural seasonality and the rand-dollar effect on renewal economics. The platform handles seasonal patterns through depot-level configuration and carries the cross-border SADC cut where assets spend half their life outside the country. It pairs with AI Camera Solutions for safety overlay on over-used vehicles and with Industries we serve for vertical templates.
Productive time over total available time per asset, with thresholds for idle, ignition-on-but-stationary, ignition-off-but-on-site and active-driving. Thresholds are configurable per fleet.
Yes, partially. Engine-hour runtime, fuel-burn trend, harsh-driving-derived wear pattern and licence-disc status work from the standard tracking device. Temperature, vibration and pressure require Equipment Monitoring Sensors.
Yes. Wireless asset tracking puts a battery-powered tracker on non-powered assets. Their utilisation is measured the same way as vehicles in the platform.
A useful baseline runs after 30 days. A right-sizing decision is reliable after 60 to 90 days of operating data across a typical demand cycle.
It will tell you which vehicles are persistently under-utilised against demand and which are persistently over-utilised. The sell decision is yours; the data underneath it is the platform's.
Yes. Per-asset utilisation feeds the day-rate decision so over-utilised stock gets the price increase and under-utilised stock gets the marketing push.
Yes. The API and webhooks push utilisation and asset-health data into your capex planning, BI or ERP environment.
The utilisation board turns each renewal decision into an evidence-led call backed by the fleet's own data. Book a demo and we will walk the Sunday-evening view with your fleet shape, so the next renewal cycle starts with the picture already in place.
Trackers and apps that turn the daily ops checklist into live, exception-driven workflow.
Object and Level Detection via Radar Bluetooth device in Barra form-factor (batteries not included)
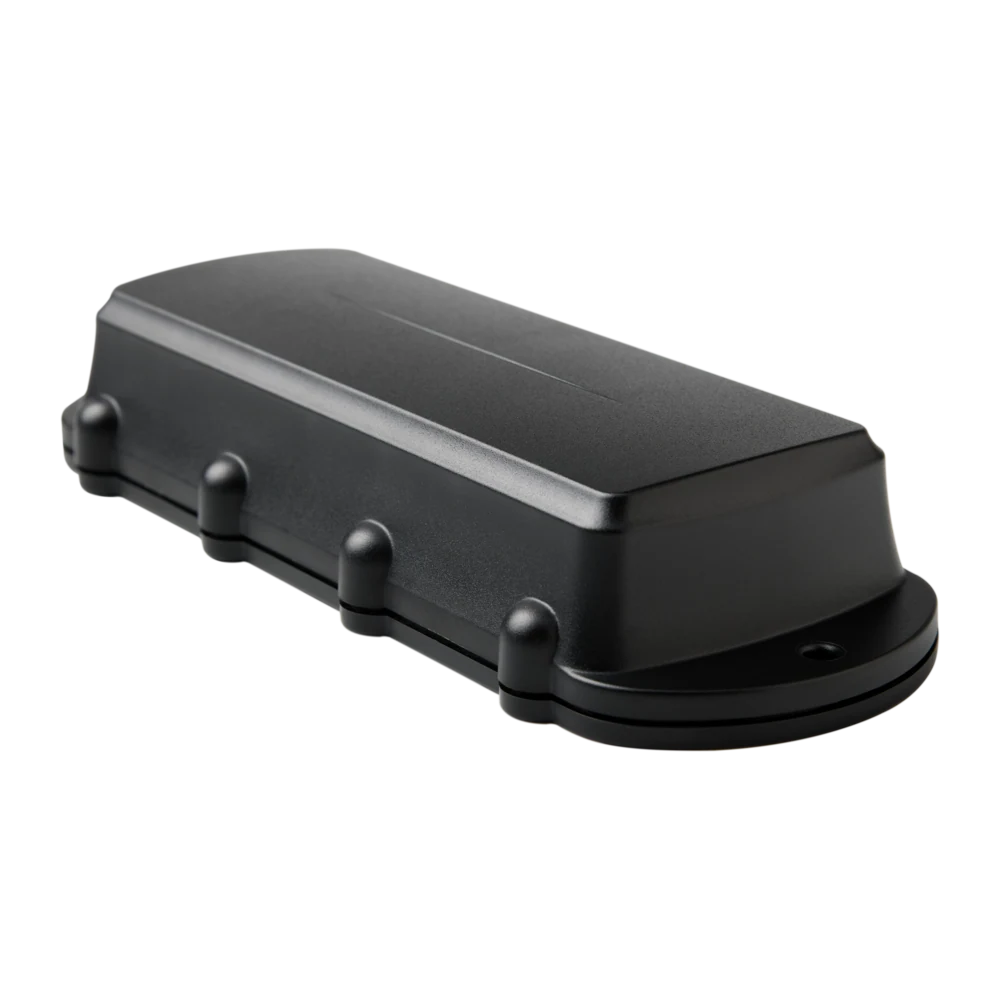
Remora3 Global GPS tracker on 4G Cat1bis with 2G fallback, Bluetooth 5.2 gateway
Remora3 GPS tracker on 4G LTE-M / NB-IoT with Bluetooth 5.2, massive battery life
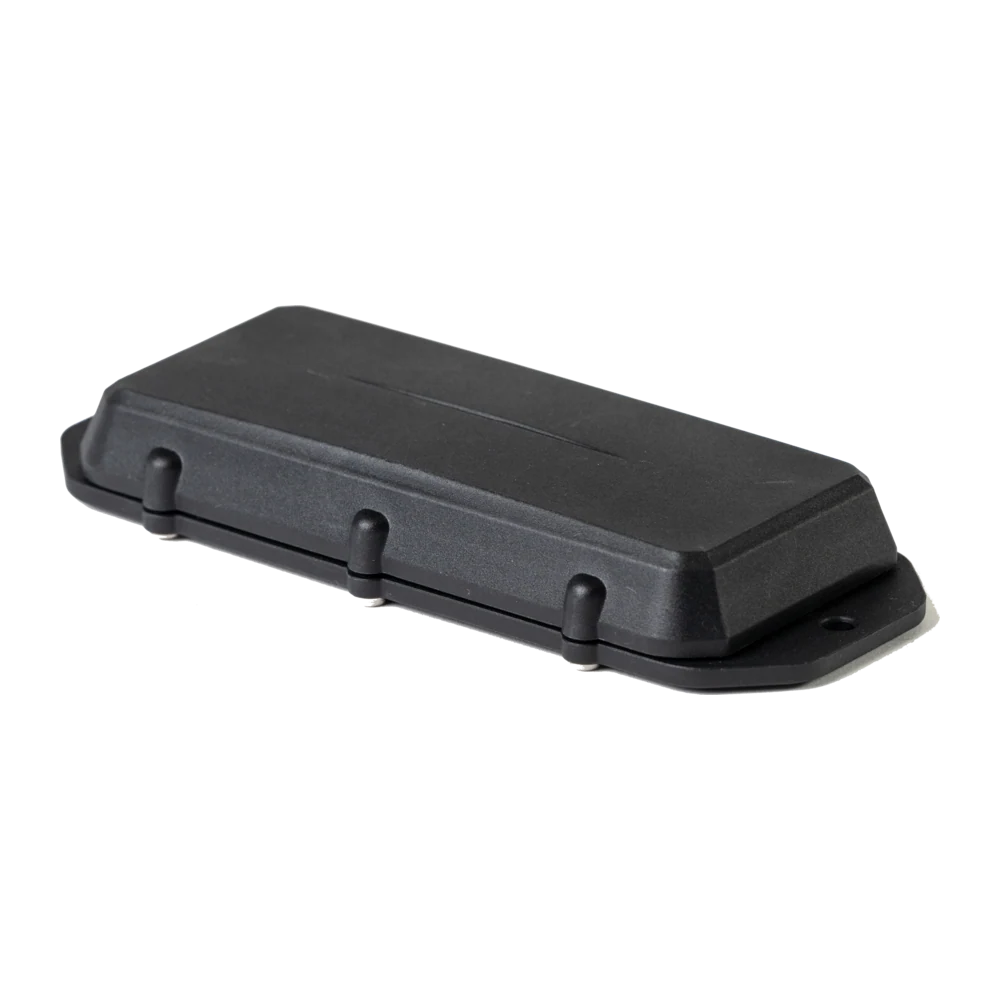
Manta form-factor GPS-only tracker on 4G LTE-M / NB-IoT
Tell us what you run, where you run it and the risk profile. We'll match the hardware, platform and rollout plan to your operation.