Power BI Dashboards for Fleet Data
Turn fleet, asset and sensor data into operational dashboards and management insights.
TG Tracking’s Business Intelligence Dashboards turn live operational data into clear, custom-built Power BI dashboards designed around your business.
Monitor fleet performance, asset utilisation, device health, cold chain exceptions, driver behaviour, trailer activity and operational anomalies in one visual reporting environment.
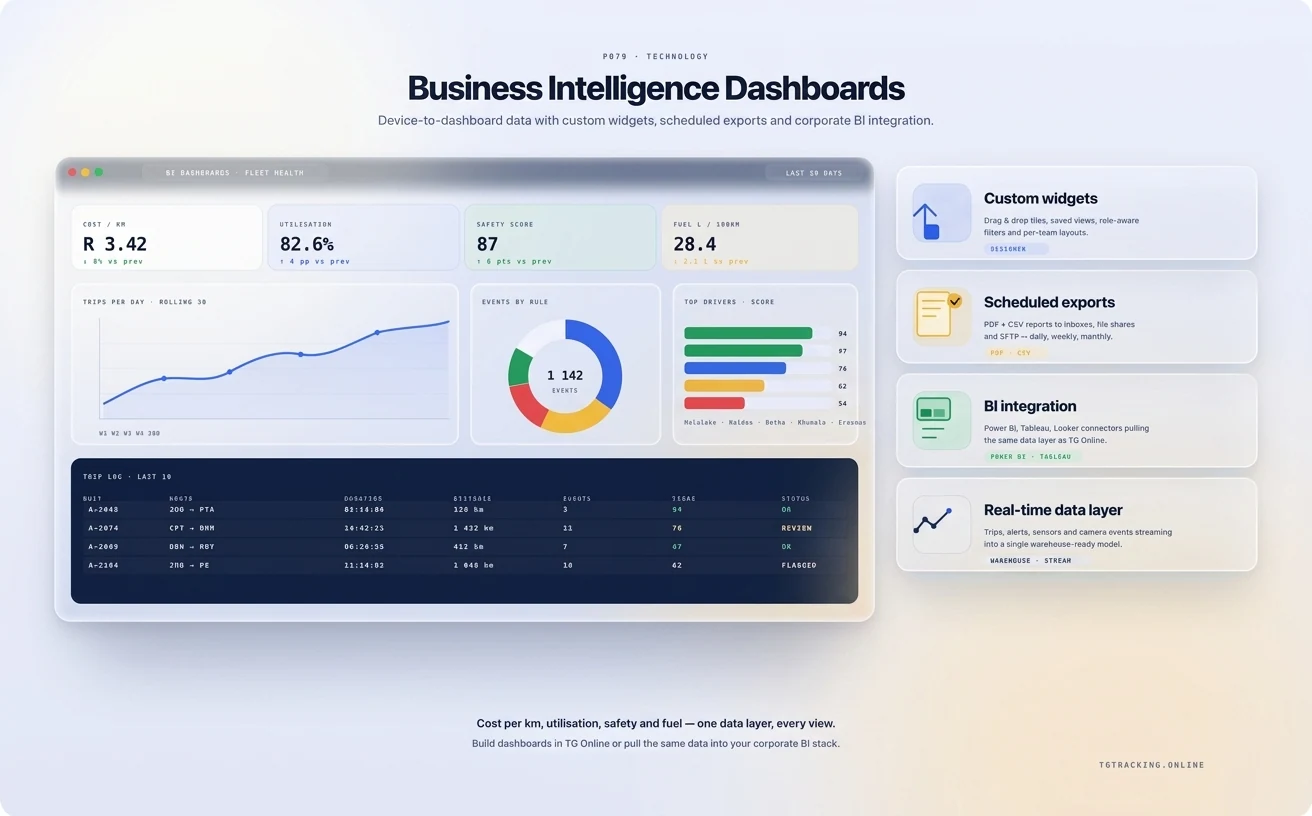
What are TG Tracking Business Intelligence Dashboards?
TG Tracking Business Intelligence Dashboards are custom-built Power BI dashboards that turn fleet, asset, sensor, camera and operational data into clear visual reports and live management views.
They are designed by TG Tracking around each customer’s specific reporting requirements and can be used by managers, controllers, executives, customers and external users with the correct permissions.
These dashboards help teams identify anomalies, monitor performance, act on exceptions and make faster operational decisions.
TG Online vs Business Intelligence Dashboards
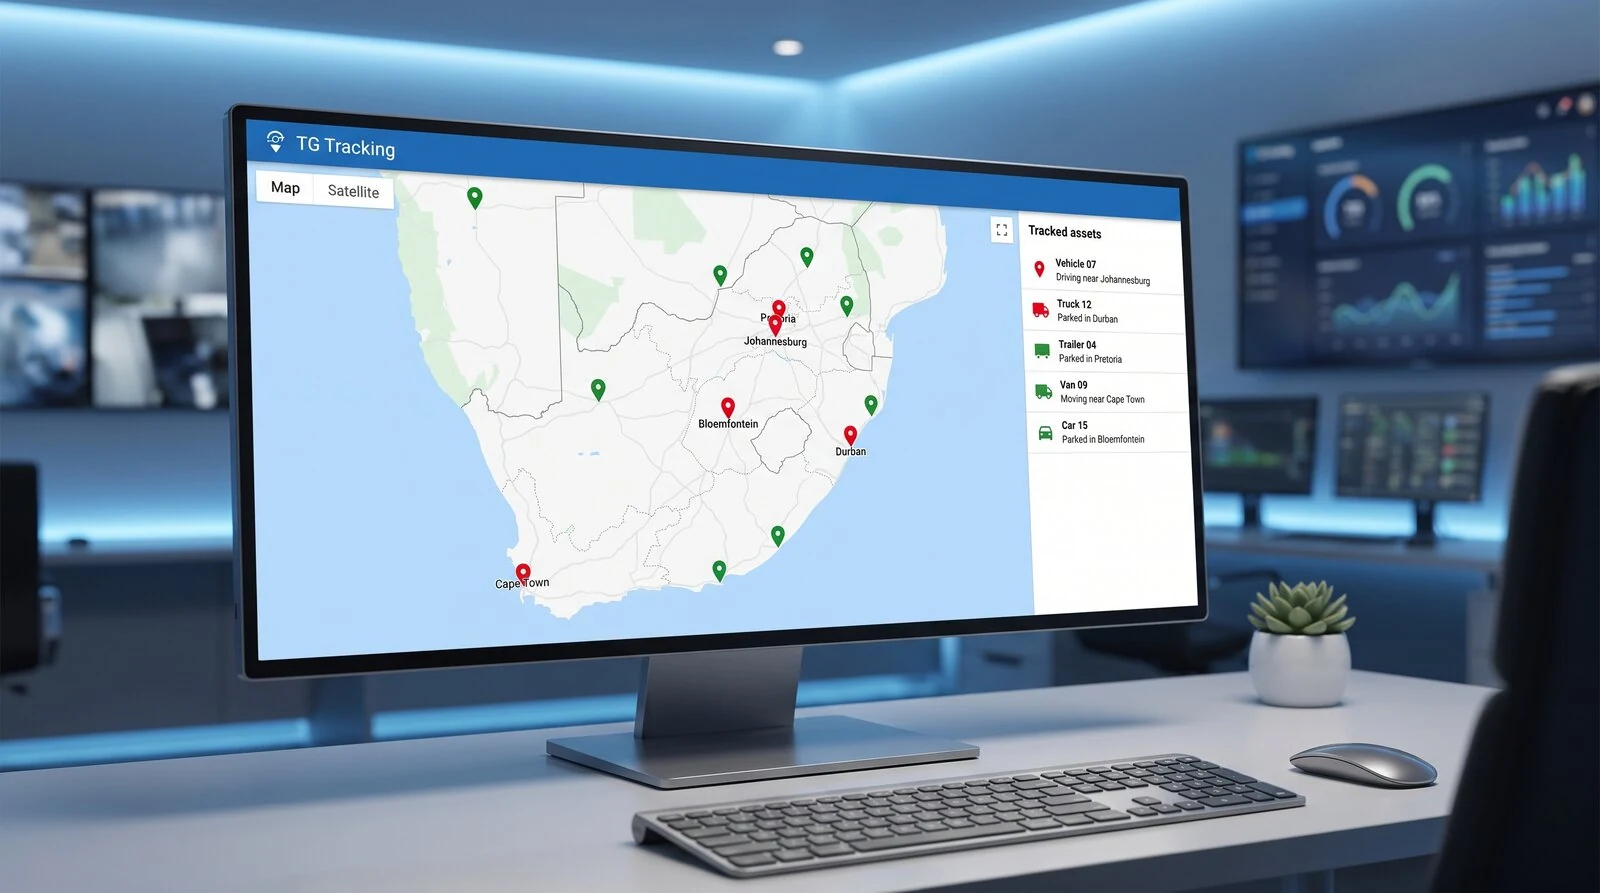 Illustrative interface
Daily tracking, alerts, reports and operational management
Fleet managers and daily system users
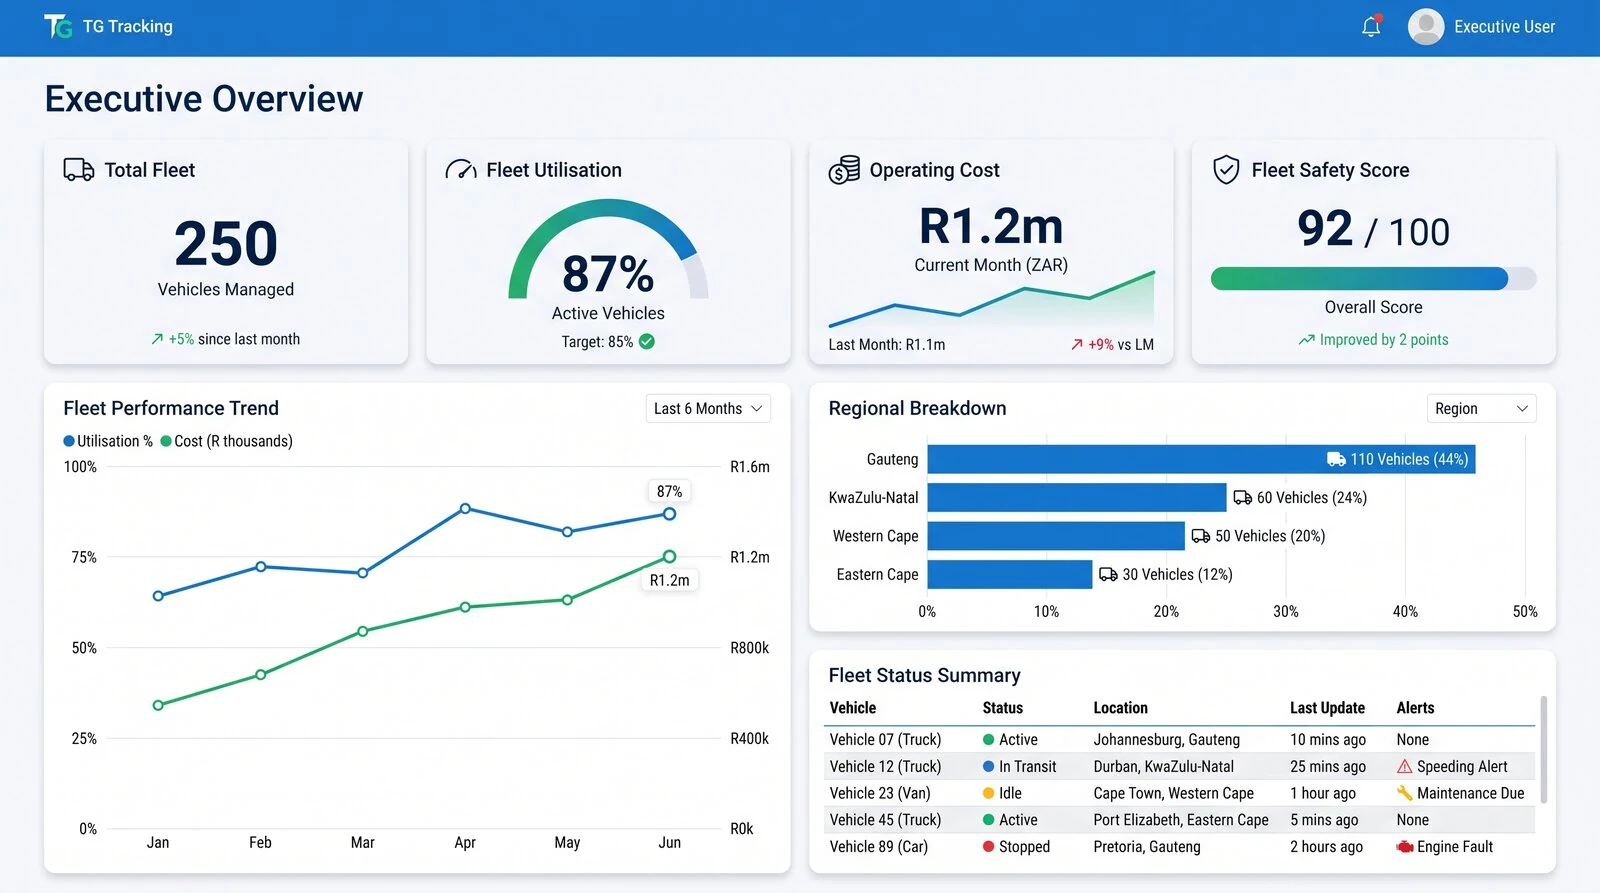 Illustrative interface
Custom Power BI dashboards for live reporting, trends, anomalies and management insights
Executives, managers, control rooms and decision-makers
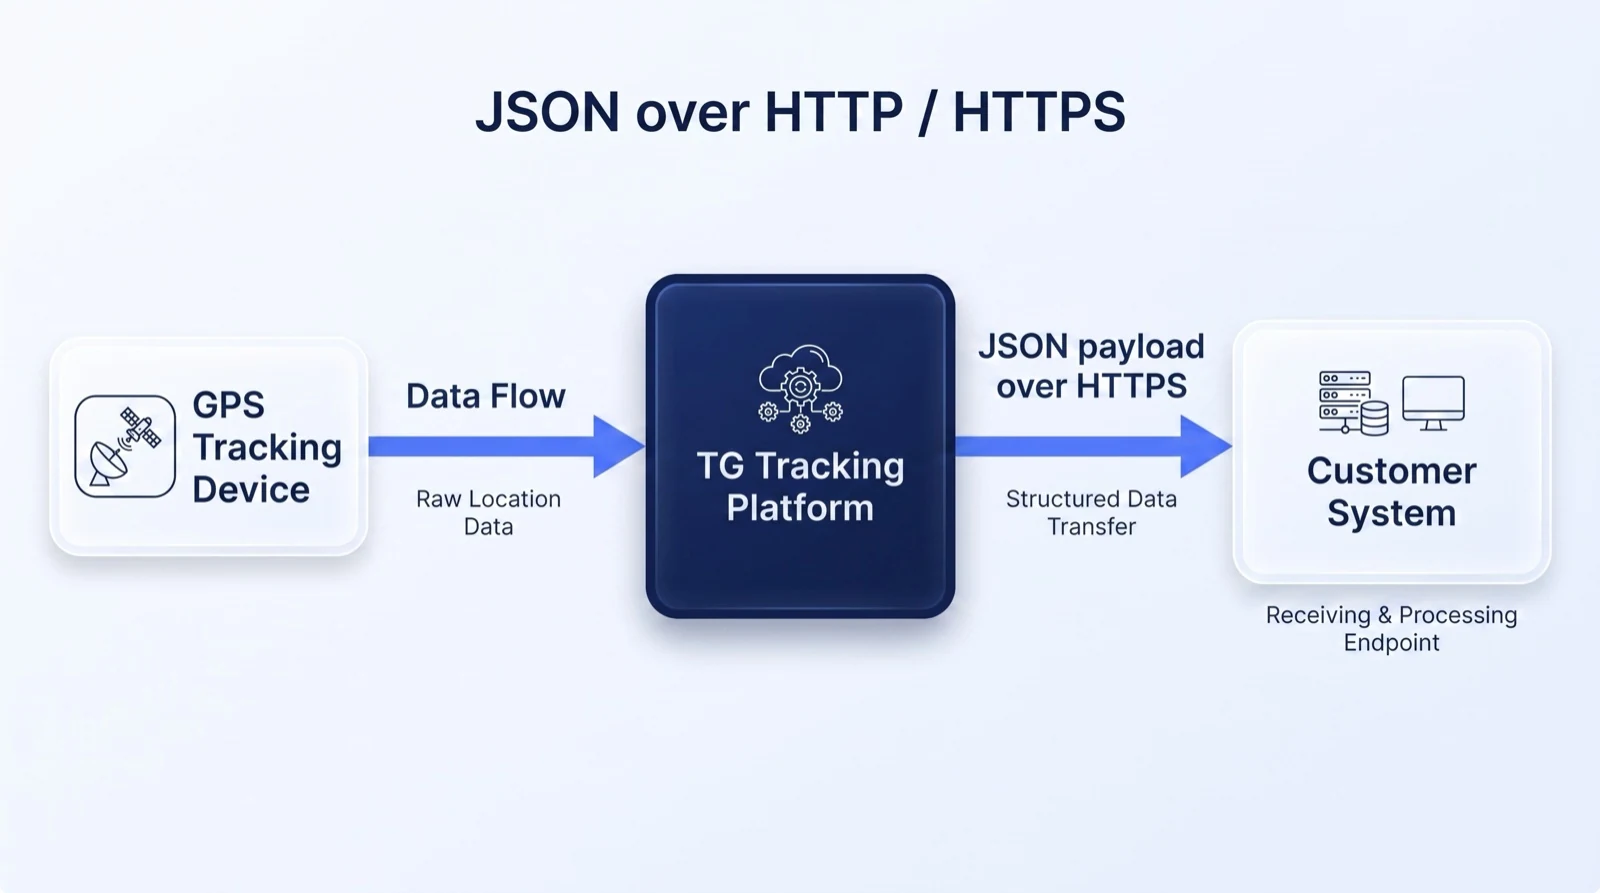
Sending TG Tracking data into external systems
Developers, IT teams and business systems
TG Online helps your team manage vehicles, assets, alerts and reports every day.
Business Intelligence Dashboards help your management team see trends, anomalies, exceptions and operational insights in a custom dashboard environment.
Built in Microsoft Power BI
TG Tracking BI Dashboards are built in the Microsoft Power BI environment.
This allows us to create powerful, visual and highly flexible dashboards that can be designed around each customer’s operational needs.
Dashboards can be built for:
Dashboards are custom-built by TG Tracking. Customers can request changes, new filters, new views or additional reporting logic as their requirements evolve.
What You Can Monitor
Fleet Movement and Productivity
Monitor movement patterns, activity levels and fleet productivity.
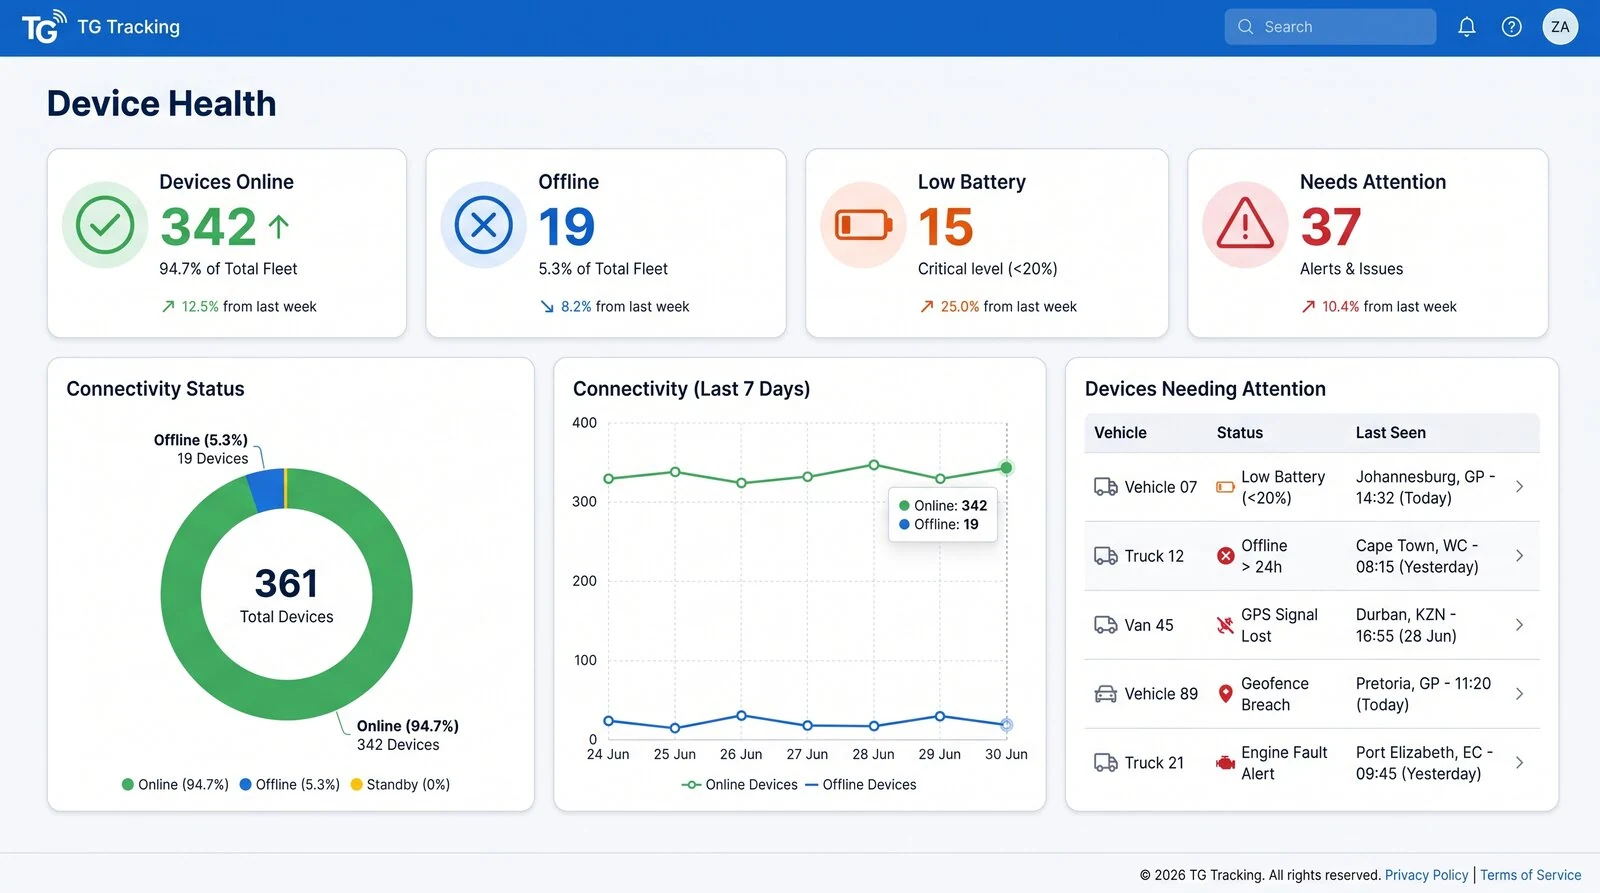
Device Health and Troubleshooting
Create live dashboards that highlight devices or assets that need attention.
This is one of the strongest use cases for control rooms and operational teams.
Driver Behaviour and Safety
View driver behaviour trends and high-risk events across the fleet.
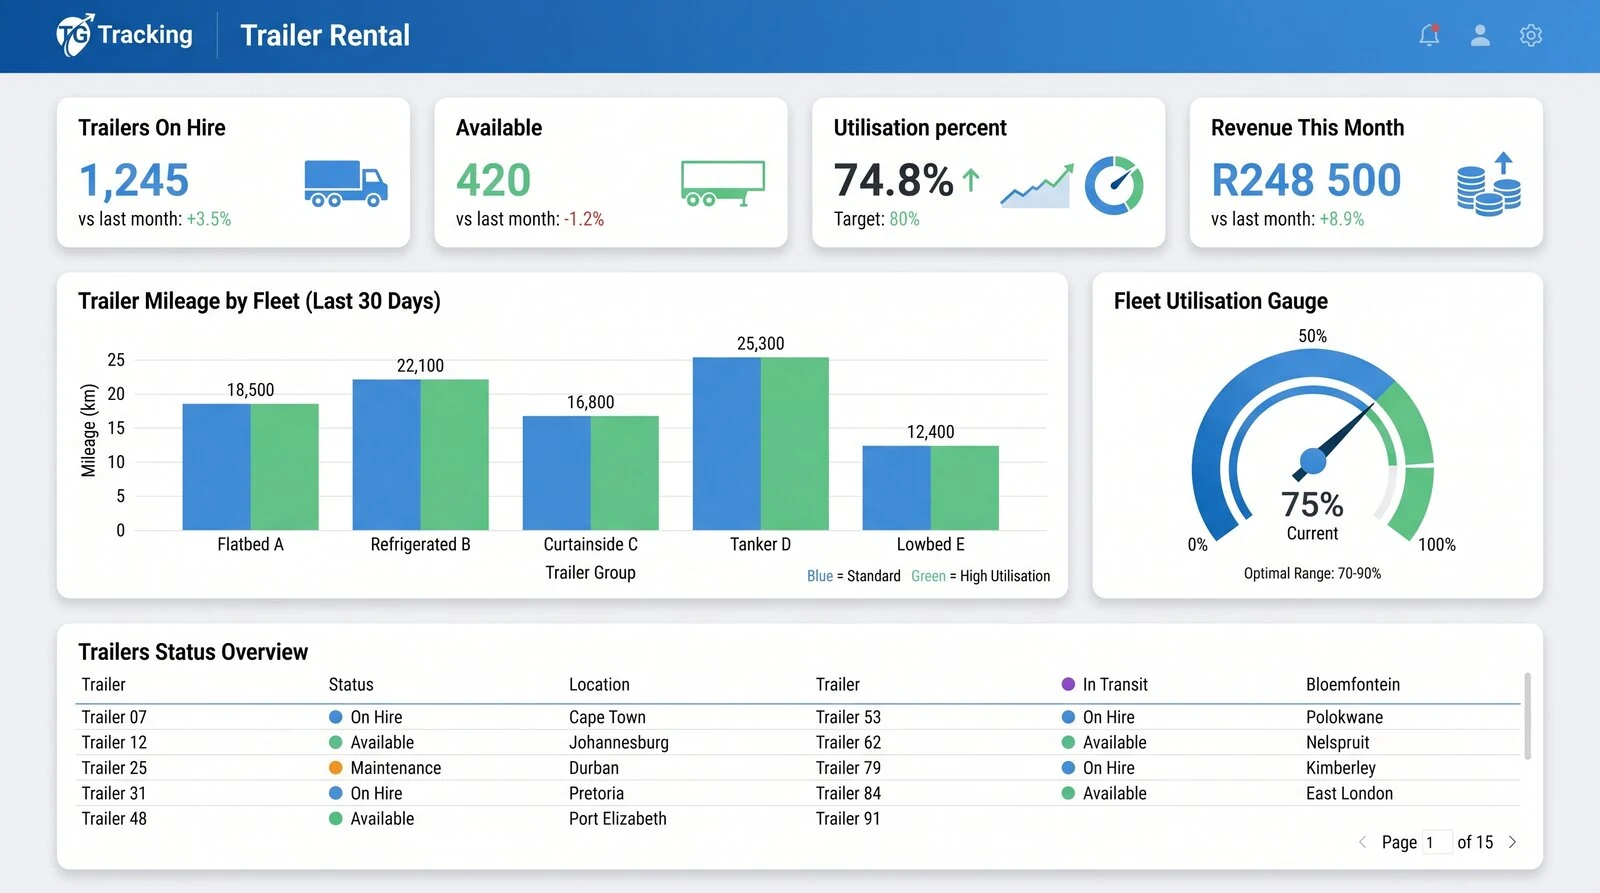
Asset and Trailer Utilisation
Understand how trailers, equipment, generators, plant and other assets are being used.
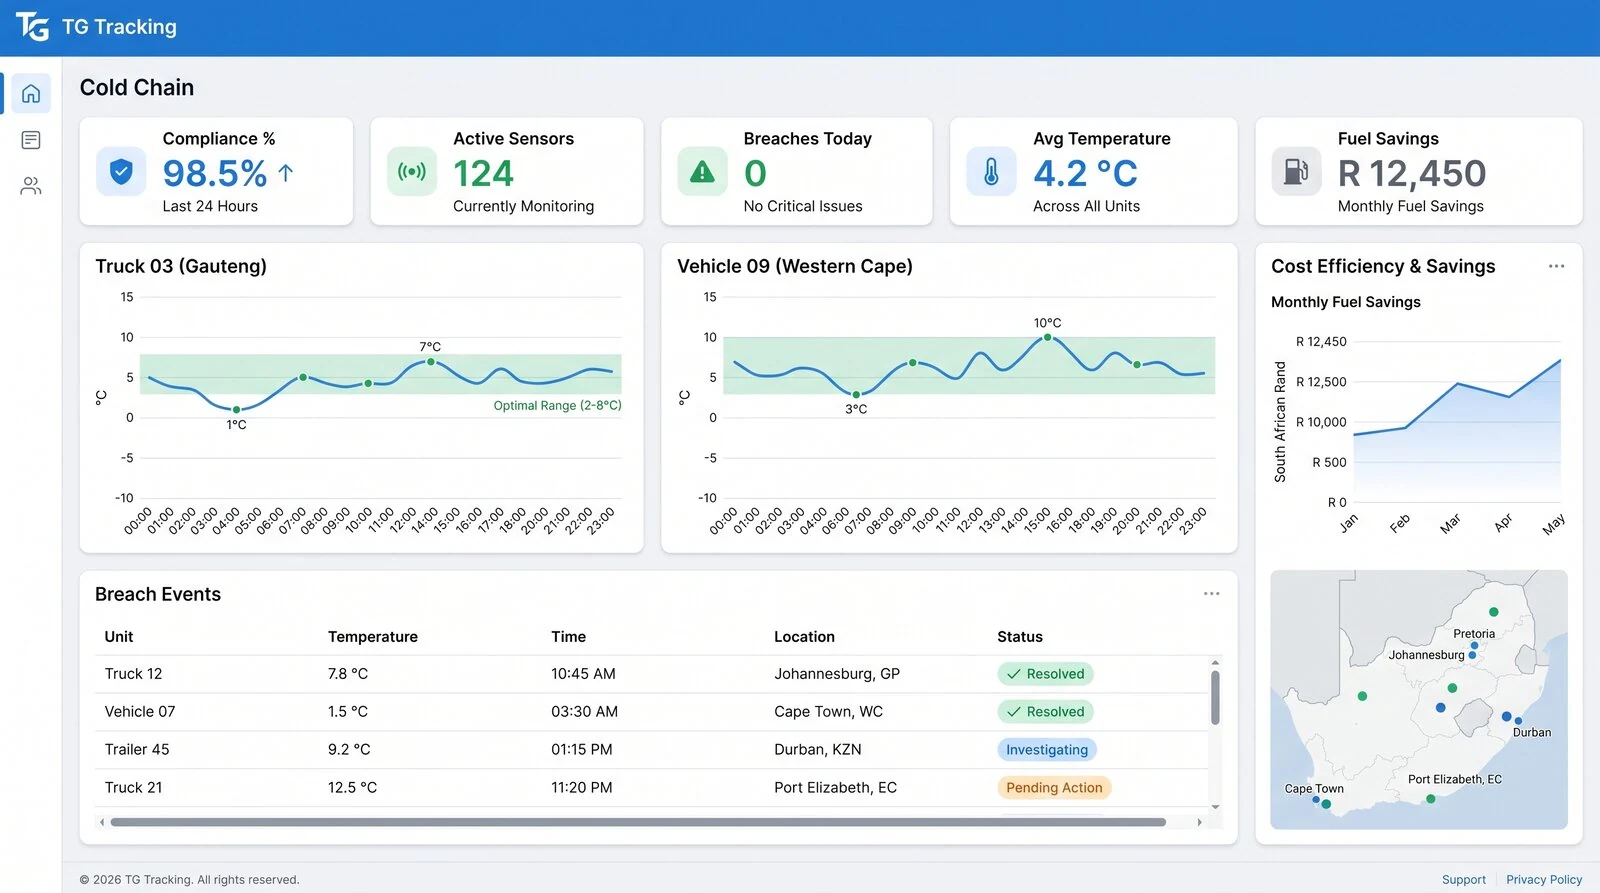
Sensor and Cold Chain Data
Turn sensor readings into practical operational views.
AI Camera and Safety Events
Turn camera events into safety insights.
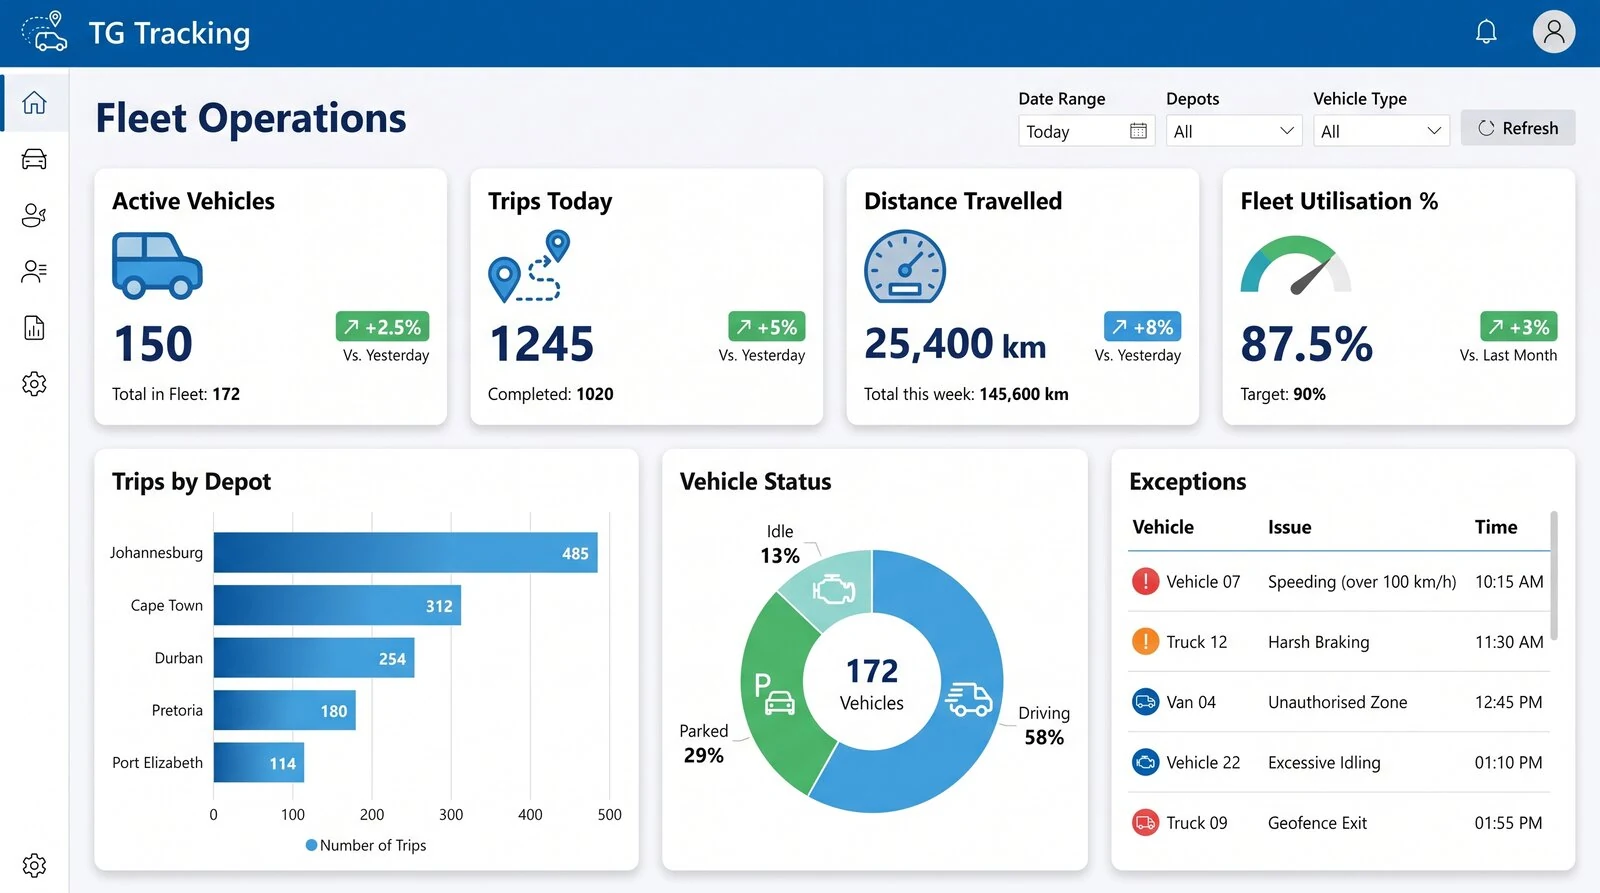
Dashboard Examples
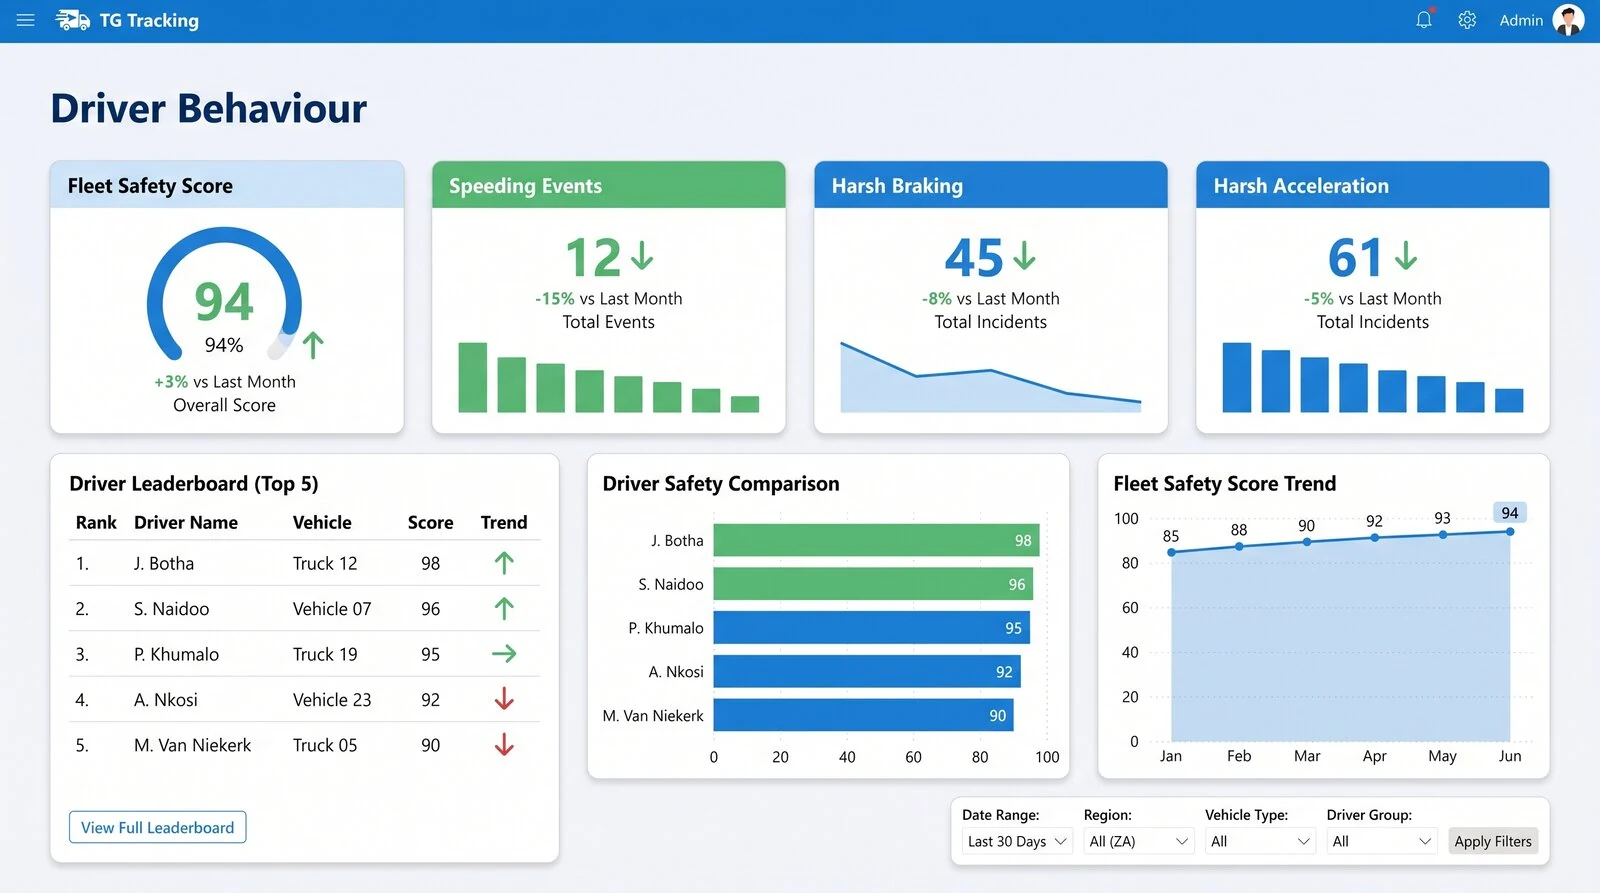
Key BI Dashboard Features
Custom Dashboard Design
Every BI dashboard is designed around the customer’s actual reporting requirements.
Power BI Environment
Dashboards are built using Microsoft Power BI for flexible visual reporting and management views.
Real-Time or Scheduled Refresh
Dashboards can refresh in real time where required, or at slower scheduled intervals depending on the data and reporting use case.
Filters and Segmentation
Dashboards can include filters by:
Permission-Based Access
Dashboards can be shared with internal users, customers or external users with different rights and permissions.
Exception Reporting
Dashboards can highlight anomalies and action-required items instead of forcing teams to search through raw data.
Live Control Room Views
Dashboards can be designed to sit on screens in control rooms, allowing teams to monitor live activity and act on exceptions.
Customer-Facing Dashboards
Selected dashboards can be shared with customers where reporting, transparency or operational visibility is required.
Built for Different Teams
Control Rooms
Monitor live exceptions, device issues, operational activity and action-required events.
Executives
View high-level performance, risks, trends and operational health.
Fleet Managers
Monitor vehicle activity, driver behaviour, maintenance indicators and utilisation.
Operations Managers
See productivity, route activity, workflow issues and operational exceptions.
Safety Teams
Review risky behaviour, camera events, fatigue, distraction and coaching priorities.
Customer Service Teams
Use selected data to support customer queries, disputes and service reporting.
External Users
Provide approved users with access to specific dashboard views and data permissions.
Business Problems BI Dashboards Help Solve
Too Much Data, Not Enough Clarity
Turn raw telematics data into clear management views.
Operational Issues Are Missed
Highlight devices, assets, vehicles or events that need attention.
Control Rooms Need Better Visibility
Create live dashboards that help controllers monitor and act quickly.
Reporting Takes Too Long
Replace manual spreadsheets with custom dashboard views and scheduled reporting.
Assets Are Underused or Hard to Track
See asset activity, trailer mileage, utilisation and movement patterns.
Cold Chain Exceptions Need Fast Action
Monitor temperature, door and breach events in a clear dashboard view.
Customers Need Better Visibility
Share approved dashboard views with customers or external stakeholders.
Industries That Benefit Most
Transport & Logistics
Track vehicle activity, driver behaviour, route performance and cross-border operations.
ExploreCold Chain Transport
Monitor temperature, door events, breaches and delivery compliance.
ExploreEquipment Rental
Understand asset usage, movement, utilisation and customer activity.
ExploreTrailer Rental
Track trailer mileage, utilisation, location and exception reporting.
ExploreMining & Heavy Equipment
Support IVMS-style reporting, safety trends and equipment visibility.
ExploreConstruction & Plant Hire
Monitor site assets, vehicles, utilisation and maintenance trends.
ExploreService & Staff Fleets
View staff vehicle activity, mileage, productivity and driving behaviour.
ExploreSecurity & Emergency Response
Track response activity, safety events, incidents and unit readiness.
ExploreAvailable as an Add-On or Standalone Product
TG Tracking Business Intelligence Dashboards can be provided as an add-on to an existing TG Tracking solution or as a standalone custom dashboard project.
Because every dashboard is designed around the customer’s data, reporting needs and user requirements, the process starts with a discussion.
TG Tracking will help define the dashboard scope, required data, users, permissions, refresh intervals and reporting objectives before proposing a custom dashboard design.
Why Businesses Use TG Tracking BI Dashboards
Custom-Built Around Your Operation
Dashboards are designed around what your business actually needs to monitor.
Better Management Visibility
See the bigger picture across vehicles, drivers, assets, sensors and operations.
Faster Operational Decisions
Use live exceptions and trends to understand what needs attention.
Stronger Control Room Monitoring
Give controllers a clear view of operational anomalies and action-required events.
Permission-Based Sharing
Share dashboard views with internal teams, customers or external users with the right access controls.
Clearer Customer and Compliance Reporting
Use dashboard views to support customer reporting, cold chain records and internal compliance.
Explore Related Pages
FAQs
What are business intelligence dashboards?
Business intelligence dashboards are visual reports that turn business data into charts, KPIs, trends, exceptions and management insights.
What are TG Tracking BI Dashboards?
TG Tracking BI Dashboards are custom-built Power BI dashboards that turn fleet, asset, sensor, camera and operational data into live reporting and management views.
Are BI Dashboards part of TG Online?
No. TG Online is the main web platform for daily tracking and fleet management. BI Dashboards are a separate custom dashboard layer built in the Microsoft Power BI environment.
Can BI Dashboards be customised?
Yes. TG Tracking custom-builds BI Dashboards around each customer’s reporting requirements. Customers can request changes, new filters, new views and additional reporting logic.
Can customers configure BI Dashboards themselves?
No. TG Tracking builds and configures the dashboards. Customers can request changes and updates as their requirements evolve.
Can BI Dashboards refresh in real time?
Yes. Dashboards can refresh in real time where required, or at scheduled intervals depending on the data source and reporting need.
Can dashboards be filtered?
Yes. Dashboards can include filters for drivers, vehicles, depots, regions, branches, customers, sites, date ranges, asset types and other configured fields.
Can dashboards be shared with external users?
Yes. Dashboards can be shared with customers or external users using different access rights and permissions.
What dashboard examples can TG Tracking build?
Examples include fleet operations dashboards, device health dashboards, cold chain dashboards, trailer rental dashboards, safety dashboards and executive dashboards.
Are BI Dashboards available as an add-on?
Yes. BI Dashboards can be provided as an add-on to TG Tracking services or as a standalone custom dashboard project.
Is pricing listed online?
No. BI Dashboard pricing depends on the dashboard design, data sources, users, permissions and reporting requirements.
Ready to Turn Fleet Data Into Clear Business Insights?
Use TG Tracking Business Intelligence Dashboards to monitor operational anomalies, fleet performance, asset utilisation, sensor data and management trends.