BARRA-RADAR-BLE · Wireless trackers
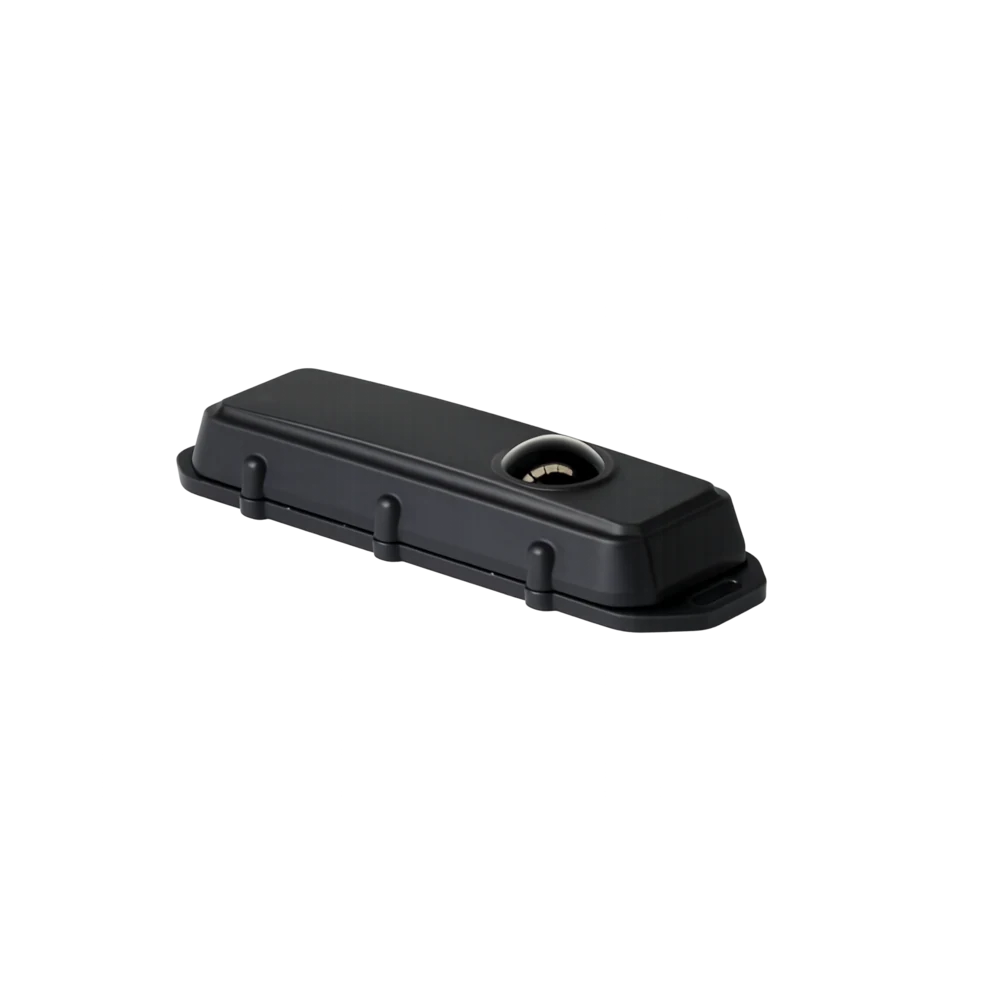
Barra Radar BLE
Object and Level Detection via Radar Bluetooth device in Barra form-factor (batteries not included)
IN STOCK · ZAR
HomeSolutionsOperations, Workflow & ProductivityDriving Performance Monitoring
Operating layer · Solution
Real-time driver behaviour insights, driver scorecards and a coaching cycle that closes the gap between top and bottom drivers in your South African fleet.

A driver coaching cycle that the whole fleet can run from the same data. Each driver carries a transparent scoreboard built from severity-banded harsh events, speeding, idling and route compliance, joined to fuel and maintenance trends so the operator, the safety officer and the driver see the same picture. The Friday review opens with the trailing 7-day board, the top three exceptions per driver and the trip replay one click below each one, ready for a ten-minute conversation that improves the next week's drive.
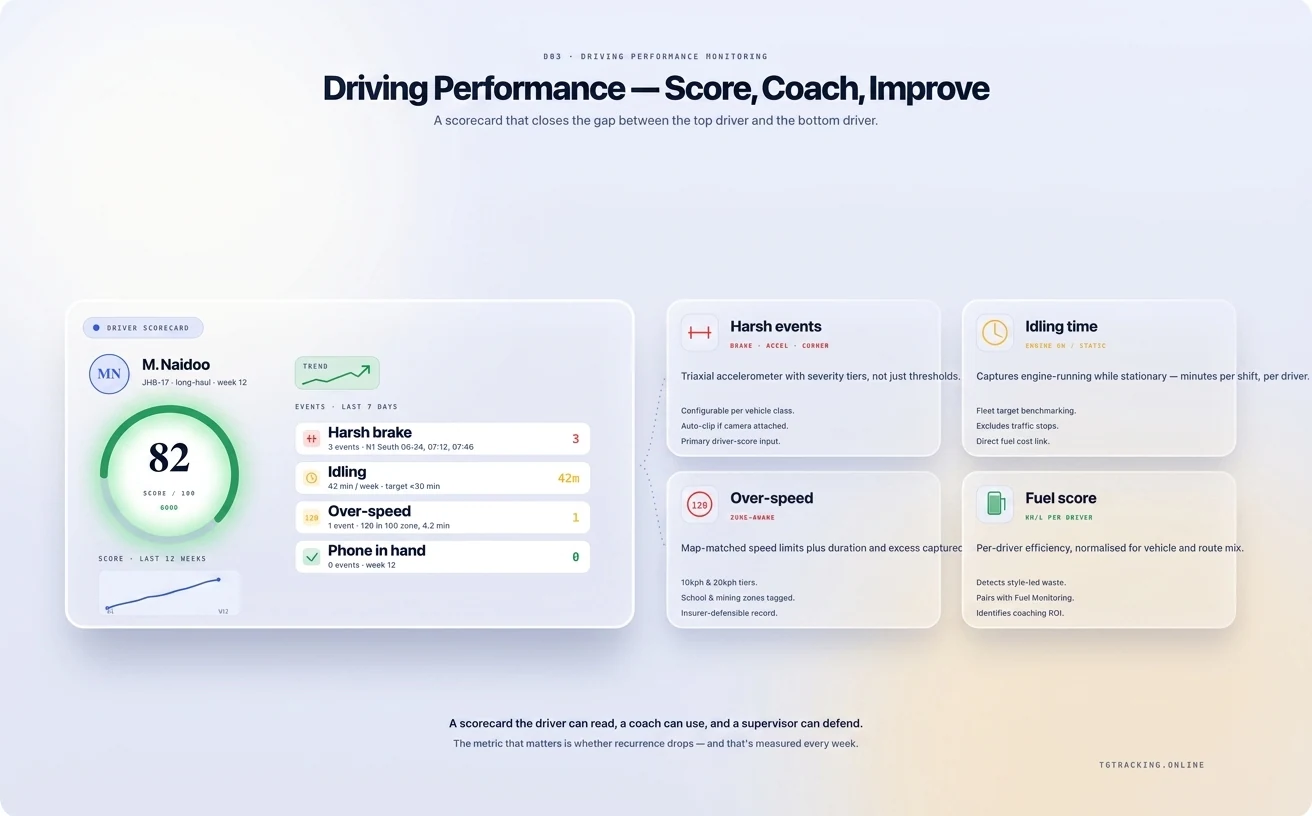
Driving Performance Monitoring from TG Tracking turns the fleet's raw telemetry into a per-driver scoreboard, a coaching workflow and an evidence trail. Harsh braking, harsh acceleration, harsh cornering, speeding, idling and route deviation all attach to a driver, not just to a vehicle. It pairs with AI Camera Solutions for in-cab context, Fleet Tracking and Management for the trip layer underneath, and Maintenance Scheduling for the wear-and-tear knock-on. The cluster overview is at Operations and Workflow.
A driver score is a weighted view of the events that matter for safety, the fuel bill and the insurance trend.
Each driver carries a profile, not a single number. The supervisor sees the trend line, the top three exceptions of the week, and the trip replay one click below each event.
A driver score that nobody acts on is data that nobody uses. The platform runs a weekly coaching cycle.
The supervisor opens the trailing 7-day board, picks the bottom three drivers, opens the trip replay for the worst event each, and sits with the driver for ten minutes. The conversation runs against video, telemetry and a known route. Coaching outcomes log on the driver's profile. The next week's board reads against the same baseline so improvement is visible. Repeat offenders surface as a separate exception list.
For mining contractors and high-compliance fleets, the same cycle feeds the Mining IVMS compliance log.
Driver scoring works when drivers see the score as a coaching tool. It backfires when the rollout reads as surveillance. The platform is configured around three rules:
Transparency. Drivers see their own score and trend line in TG Online or on a kiosk. The supervisor's view and the driver's view are the same data.
Severity bands. A 5 km/h-over event in light traffic is not the same as a 22 km/h-over event in a school zone. The score reflects the difference.
Right of reply. The trip replay is available to the driver before any disciplinary conversation. Most disagreements close on the first viewing because the data is clear, not contested.
The supervisor opens the trailing 7-day board on a Friday. The safety officer opens the rolling 30-day trend on a Tuesday. The finance director sees monthly litres-per-100-km and brake-replacement spend joined to the driver-score quartile. Same data, three cuts, no spreadsheets.
The data plugs into Fuel Monitoring, Maintenance Scheduling and Fleet and Asset Utilisation Tracking. The API and webhooks push the score to your HR or training platform.
Local fleets coach against local realities. Highveld thunderstorms shift braking events. Free State dust shifts following-distance scoring. Mining contractor protocols are stricter than commercial defaults . AARTO infringements need to align with on-fleet speeding events for the disciplinary record . Thresholds are configurable per fleet so a long-haul operator and a last-mile courier do not run the same scoreboard.
A weighted blend of severity-banded events across speeding, harsh driving, idling, route compliance and (where fitted) AI camera events, normalised against trip length and route profile. The weights are configurable per fleet.
Most fleets find drivers settle into the system within the first month when the rollout is framed as coaching, the score is transparent, and right-of-reply is built into the workflow. See AI Camera Solutions for the rollout pattern.
Yes. Many fleets run a quarterly safe-driver bonus tied to score improvement. The platform exports the scoreboard and the supporting events.
Vehicle telemetry covers the vehicle. Where private use is allowed, the trip can be marked private and excluded from scoring.
The trip replay opens at the event timestamp with telemetry and (where fitted) video. Most disputes close on the first viewing. Where they do not, the supervisor can adjust or annotate the event with a reason.
Yes. The scoring engine is vehicle-agnostic. Severity thresholds tune to vehicle class.
Yes. Telemetry-only scoring covers harsh events, speeding, idling and route compliance. Adding AI Camera Solutions extends the score with distraction, fatigue and following-distance.
A weekly coaching cycle on shared data lifts the whole fleet's average over time. Book a demo and we will set up the scoreboard with your real driver list, so the first coaching conversation runs against your actual trip data, not a sample.
Trackers and apps that turn the daily ops checklist into live, exception-driven workflow.
Object and Level Detection via Radar Bluetooth device in Barra form-factor (batteries not included)
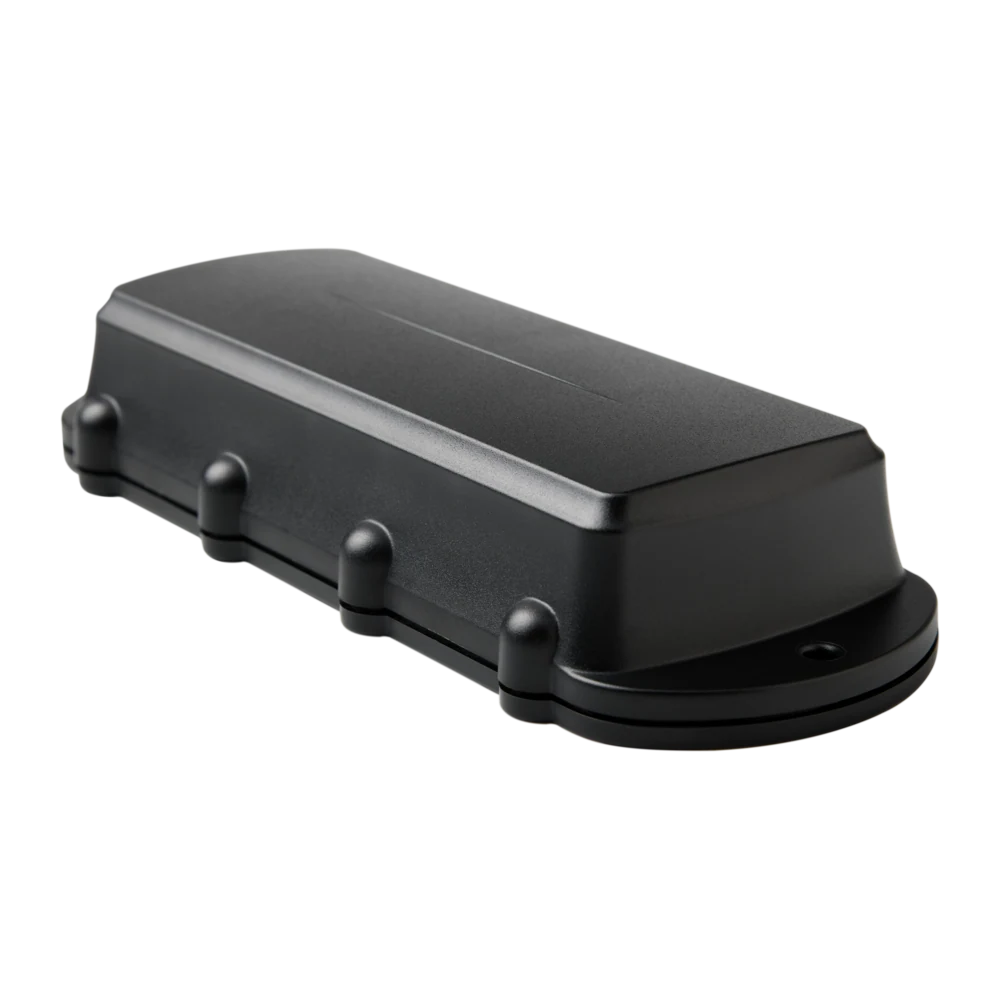
Remora3 Global GPS tracker on 4G Cat1bis with 2G fallback, Bluetooth 5.2 gateway
Remora3 GPS tracker on 4G LTE-M / NB-IoT with Bluetooth 5.2, massive battery life
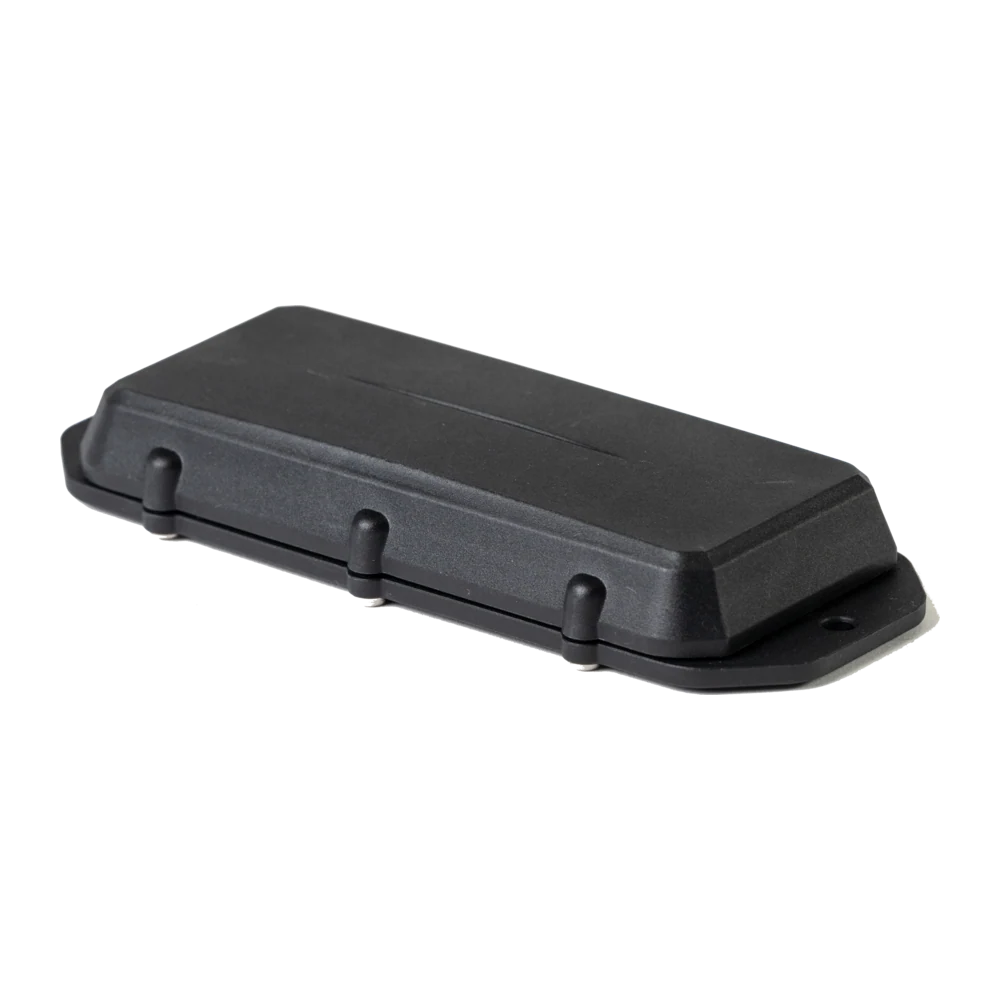
Manta form-factor GPS-only tracker on 4G LTE-M / NB-IoT
Tell us what you run, where you run it and the risk profile. We'll match the hardware, platform and rollout plan to your operation.