DASHBOARDS
Live fleet, asset and driver views. Operational KPIs, exception alerts, custom reports. Export to PDF, CSV or your BI stack.
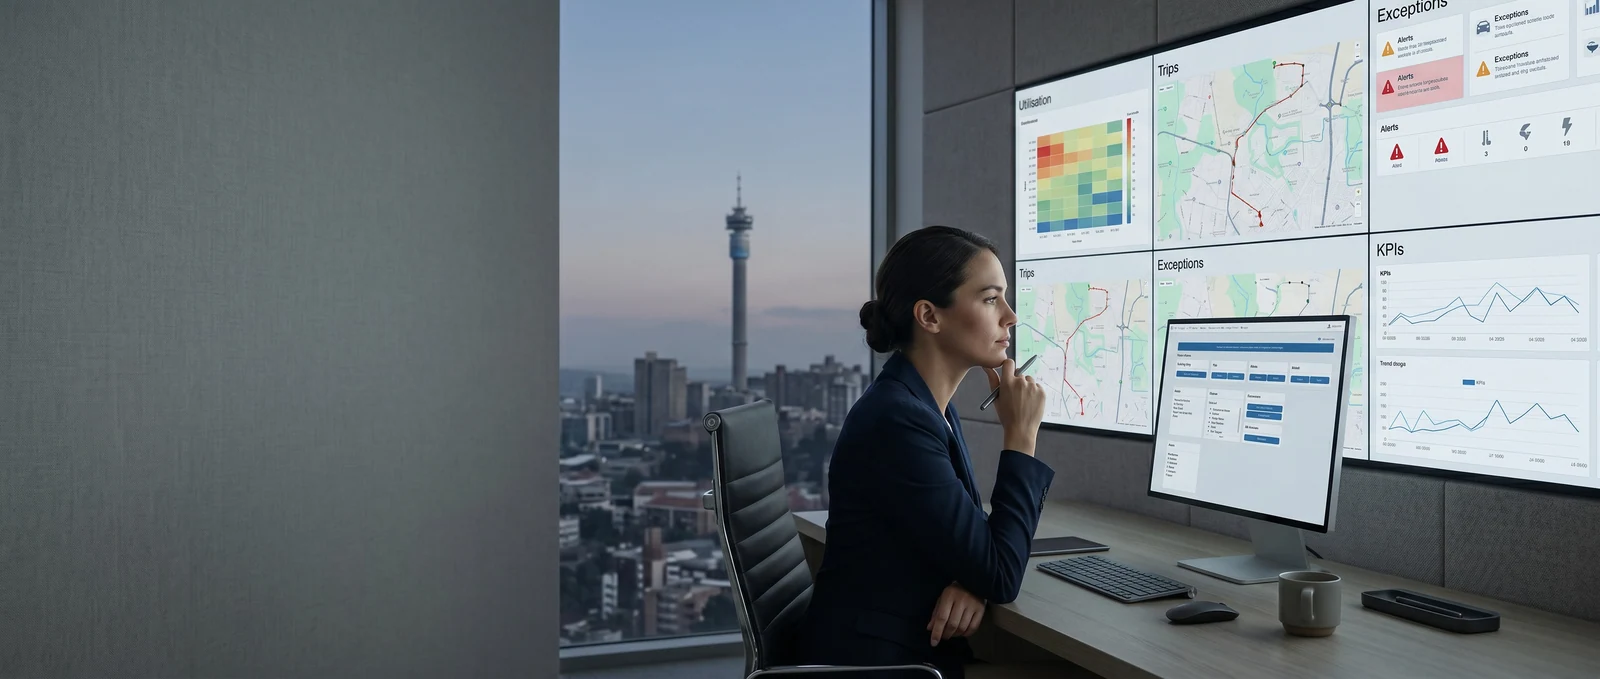
Decisions backed by data, on the same dashboard the operations and finance teams already share. Fuel cost per kilometre by route, idle hours by depot, harsh-event score by driver and the four lines that explain a month-on-month cost movement all sit on one screen, with the supporting trips, drivers and routes one click away. The Monday exec meeting opens with the picture in hand, not with a question that has to wait for spreadsheets to load.
Direct answer
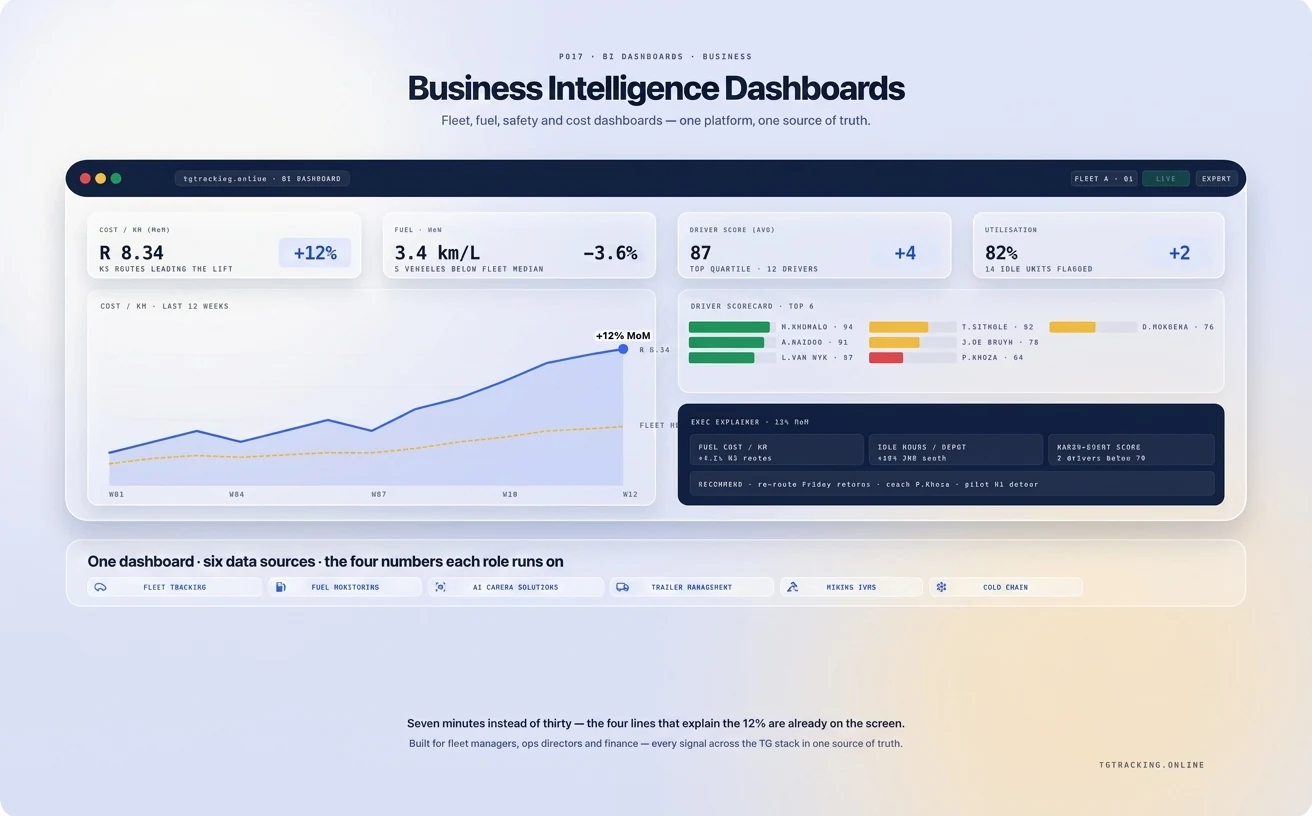
TG Tracking Business Intelligence Dashboards turn the platform's raw fleet data into the four or five numbers each role in your operation actually runs on. They consolidate signals from your Fleet Tracking and Management, Fuel Monitoring, AI Camera Solutions, Trailer Management, Mining IVMS and Temperature and Cold Chain Monitoring into one shared source of truth. For the platform-level view of how the BI layer is built and what it integrates with across the whole TG Tracking stack, see the platform-level overview.
What the BI layer does for a Business fleet
Fleet platforms generate large volumes of data. The dashboard layer is the translation between that volume and a fleet manager's, operations director's or finance director's actual decisions.
Driver behaviour scorecards
Speeding, harsh braking, harsh acceleration, harsh cornering, fatigue indicators, AI camera events and compliance scores tied to a single driver, with cohort comparisons by depot, route or shift. Scorecards drive coaching, incentives, HR conversations and disciplinary processes. The same record satisfies insurance and regulatory reporting where required.
Vehicle utilisation and productivity
Idle versus active time, daily and weekly utilisation by vehicle, route efficiency, trip history, mileage, downtime and asset allocation. Underused vehicles, over-utilised vehicles and chronically idle units surface as named exceptions rather than as a hunch from the depot manager.
Fuel and cost insights
Litres per kilometre, fuel cost per trip, fuel cost per route, idle fuel burn, fuel theft alerts and driver fuel-efficiency ranking, joined to the trip data so that a high-cost driver shows the route, the load and the harsh-event score that explains the cost. Reconciliation against bowser and fuel-card data lives on the same dashboard.
Safety and risk view
Driver risk scores, AI camera events, harsh-event timelines, collision alerts, speeding reports and eco-driving insights in one place. The operations director sees the risk profile of the fleet by week. The safety officer sees the open coaching items. The finance director sees the loss-rate trend on insurance claims, joined to the events that caused them.
Maintenance and vehicle health
Service due dates by vehicle, condition status by usage, engine warnings on OBD-fitted vehicles and predictive maintenance flags. Breakdowns get caught earlier when the dashboard surfaces the pattern rather than waiting for the breakdown.
Roles and decisions: who uses what
The platform serves several distinct roles inside a Business fleet, and each one looks at a different cut of the same data.
Fleet manager view
Live map, today's exception list, top five risk drivers, top five fuel anomalies, today's maintenance schedule, today's open recovery and theft alerts. The fleet manager opens this dashboard at 06:30 and closes it at 18:00, and the day's decisions flow from it.
Operations director view
Weekly utilisation by depot, weekly cost per kilometre by route, weekly safety-score trend, weekly customer-delivery performance and the rolling exception list by category. The operations director's view is where weekly stand-ups and monthly exec packs are built.
Safety officer view
Open coaching items, recurrence rate by driver, AI camera event trend, IVMS and compliance reporting export, accident and incident log. For mining contractors and high-compliance operators, this view is the one the safety committee asks for.
Finance and exec view
Cost per kilometre, cost per route, cost per customer, total cost of ownership trends, insurance claim trend, accident cost and the variance against budget. This is where the answer to the 12% question lives.
Why TG Tracking BI for the Business view: integrated cost, safety and utilisation
A standalone BI tool can only show what is given to it. If the fleet data lives in one platform, the fuel data in a second, the camera data in a third and the maintenance schedule in a spreadsheet, the BI layer either gets a sanitised partial picture or it spends its life on data plumbing.
TG Tracking's BI sits inside the platform that already owns the data. The signals from Fleet Tracking and Management, Fuel Monitoring, AI Camera Solutions, Trailer Management and Mining IVMS join up at trip level, driver level, vehicle level and depot level without an ETL project. The cost-per-kilometre on a Highveld route is broken down into fuel, driver, maintenance and incident cost using the same data that fired the alerts. The 12% MoM increase has its own decomposition by line.
For operators who already run a corporate BI environment, the API and webhooks push the same data into your existing stack. We do not insist that TG Tracking BI is the only dashboard you use. We insist that the source of truth is the platform that captured the events, not a copy that grew out of sync.
South African context: fleet cost in a high-input-cost economy
South African fleets are run in a cost environment that does not give margin for invisible waste. Fuel is a large share of operating cost and changes monthly. Maintenance costs swing with parts availability and exchange rates. Driver-related insurance loadings are significant, particularly for high-claim industries. Load shedding interferes with depot operations and adds costs that did not exist five years ago.
The dashboards are built around those realities. Cost decomposition by route covers the long-haul corridors operators actually run, including the N1 between Johannesburg and Cape Town, the N3 between Johannesburg and Durban, the N2 between Cape Town and Durban, and the cross-border runs into Mozambique, Zimbabwe and Botswana. AARTO infringement, RTMC and IVMS reporting are built into the templates. Multi-depot fleets see the same metrics by depot, by region and by sub-fleet without spinning up new dashboards every quarter.
Frequently asked questions
How is this different from the BI Dashboards page under Technology?
This page is the Business cluster view, framed for the fleet manager, operations director, safety officer and finance director. The Technology page is the platform-level overview that covers how the BI layer is built, which data sources it ingests and which corporate BI tools it integrates with. See the platform-level overview for the technical and integration story.
Can I customise the dashboards for my industry?
Yes. Logistics, mining, cold chain, rental, public transport, agriculture and field service all have starter dashboards configured for their specific KPIs. Custom layouts, custom KPIs and custom data blocks are part of the platform, not a paid bolt-on.
What about scheduled reports for non-platform users?
Scheduled email reports in PDF and Excel are part of the platform. The exec who does not log in to TG Online still gets a weekly fleet pack in the inbox, with the four or five numbers their meeting runs on. Compliance audit packs and customer reports are scheduled the same way.
Can I export data into our own BI environment?
Yes. The API and webhooks push data into Power BI, Tableau, Looker, Sheets and most enterprise BI environments. Specific integrations are scoped during onboarding. Scheduled exports are also available where API access is not appropriate.
Does the BI layer cost extra?
A baseline dashboard set is part of the platform. Custom dashboards, deep historical retention and corporate BI integrations are scoped per customer and depend on data volume and complexity. We will quote against your specific reporting needs rather than sell a tier that may not fit.
How quickly can a new dashboard be built?
A dashboard built from existing platform data is typically a configuration exercise rather than a development one. Custom KPIs that combine platform data with your external data feeds depend on the integration complexity. We will give you a realistic timeline rather than a marketing one.
Does this work for a small fleet?
Yes. The starter dashboards work for a 5-vehicle fleet and a 5 000-vehicle fleet. The benefit ratio is different at the small end because the questions a small fleet asks are usually answerable directly from TG Online without a dedicated dashboard, but the BI layer is included rather than gated.
Talk to our BI team
The BI layer turns the platform's signal into the four or five numbers each role in the operation runs on. Book a dashboard demo and we will walk you through the fleet manager, operations director and finance views with your fleet shape and reporting cadence in mind.
Recommended hardware
The right tracking layer for business intelligence dashboards.
Vehicle, asset, driver and reporting hardware tuned to the way real businesses run fleets.

BARRA-RADAR-BLE · Wireless trackers
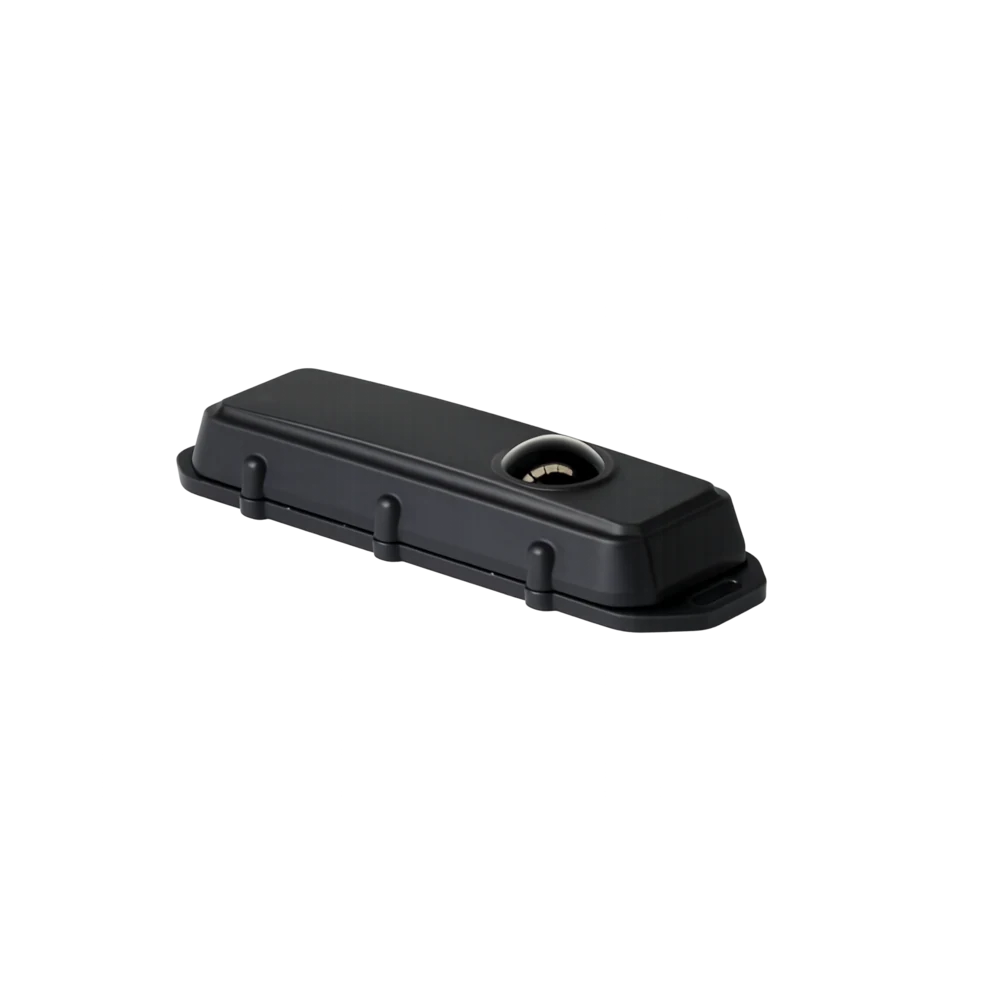
Barra Radar BLE
Object and Level Detection via Radar Bluetooth device in Barra form-factor (batteries not included)
IN STOCK · ZAR
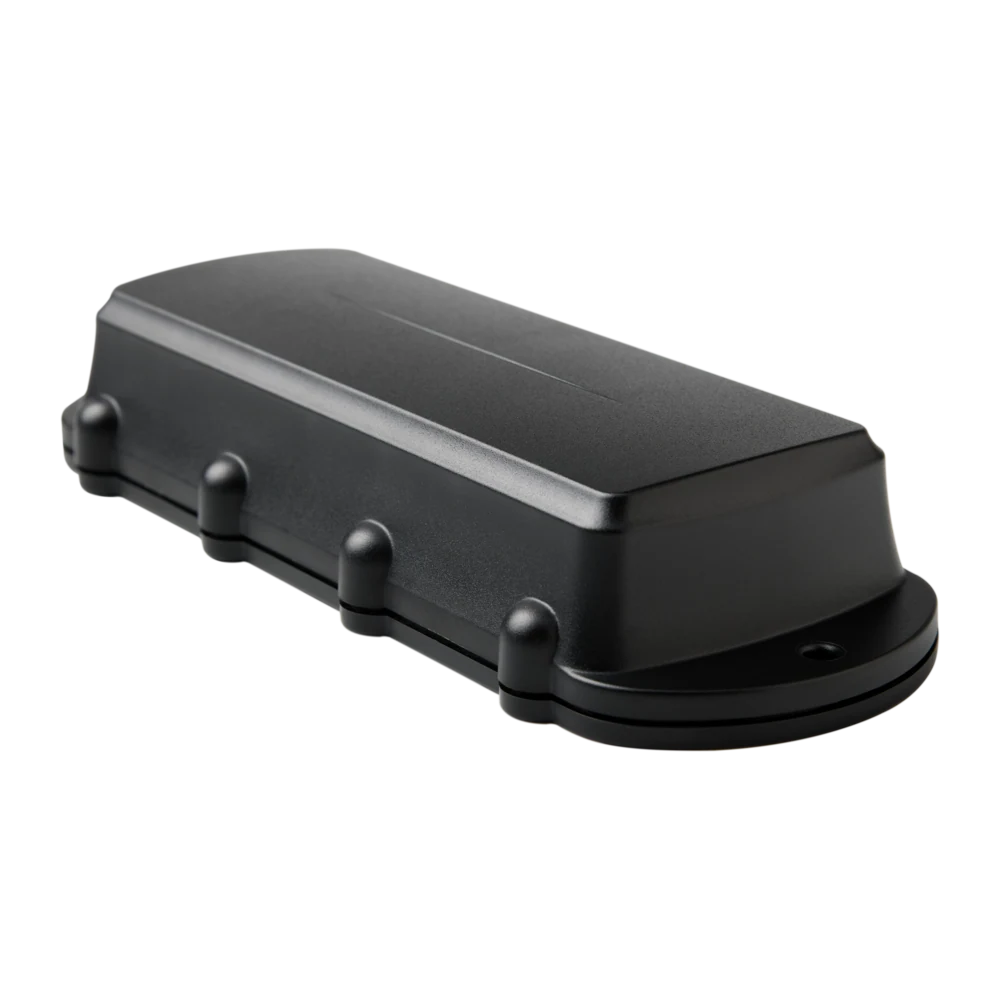
REMORA3-GLOBAL · Wireless trackers
Remora3 Global
Remora3 Global GPS tracker on 4G Cat1bis with 2G fallback, Bluetooth 5.2 gateway
IN STOCK · ZAR
More in Business
Business overview
Related business solutions.
Talk to TG Tracking
Add Business Intelligence Dashboards to your fleet operating layer.
Tell us what you run, where you run it and the risk profile. We'll match the hardware, platform and rollout plan to your operation.